Revenue leakage rarely comes from one obvious failure. More often, it compounds through small inefficiencies across interconnected stages of the revenue system:
The Revenue Leakage Map™ helps organizations visualize where those gaps may exist and how they may influence overall performance.
Even when businesses generate demand, revenue can still be lost through operational inefficiencies, conversion friction, weak visibility, inconsistent follow-up, delayed response, and breakdowns across the broader revenue ecosystem.
These inefficiencies often remain difficult to identify because they occur gradually across multiple operational layers.
Small inefficiencies may seem isolated individually. Collectively, they can materially impact:
The Revenue Ecosystem Map™ models the seven interconnected stages that influence revenue performance, customer flow, operational alignment, conversion efficiency, and long-term growth.
Because each stage influences the others, inefficiencies in one area often create downstream effects throughout the broader ecosystem.
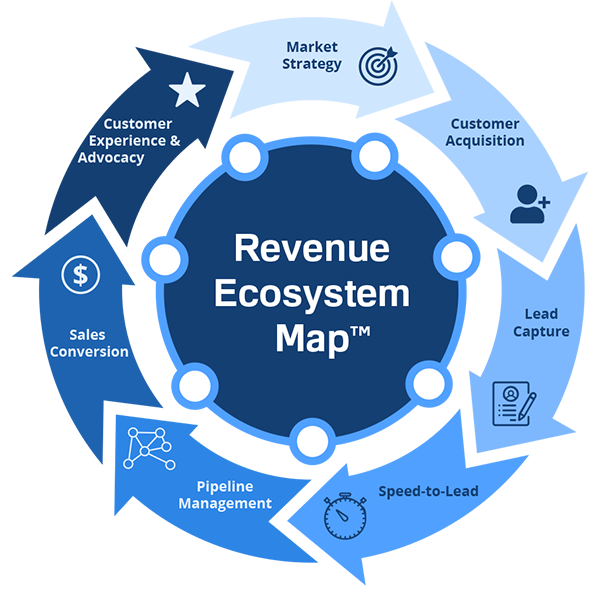
Many organizations underestimate how much revenue can be influenced by relatively small improvements across multiple stages of the revenue system.
Current performance: $200,000 monthly revenue
If operational improvements increase conversion to 25%:
Optimized performance: $250,000 monthly revenue
That represents an additional $50,000 per month without increasing lead volume.
| Metric | Current System | Optimized System |
| Monthly Leads | 200 | 200 |
| Close Rate | 20% | 25% |
| Avg Client Value | $5,000 | $5,000 |
| Monthly Revenue | $200,000 | $250,000 |
Understanding where those opportunities exist—and what they may be worth—is often the first step toward improving revenue system performance.
The Revenue Leakage Map™ helps organizations visualize where operational friction, conversion inefficiencies, delayed response, weak visibility, retention issues, and other forms of revenue leakage may exist across the seven‑stage revenue ecosystem.
Rather than evaluating isolated tactics independently, the framework evaluates how leakage in one stage may influence performance across the broader system.
The objective is not simply identifying symptoms. The objective is understanding where inefficiencies may be compounding throughout the revenue ecosystem.
| Tool | Purpose |
| Revenue Leakage Estimator™ | Quantifies the financial impact of leaks (free, 2 minutes) |
| Revenue Leakage Map™ | Visualizes where leaks occur (this page) |
| Revenue Leakage Index™ | A headline metric from a full Diagnostic engagement |
The Revenue Leakage Map™ is part of the Revenue Pipeline Diagnostic™ engagement.
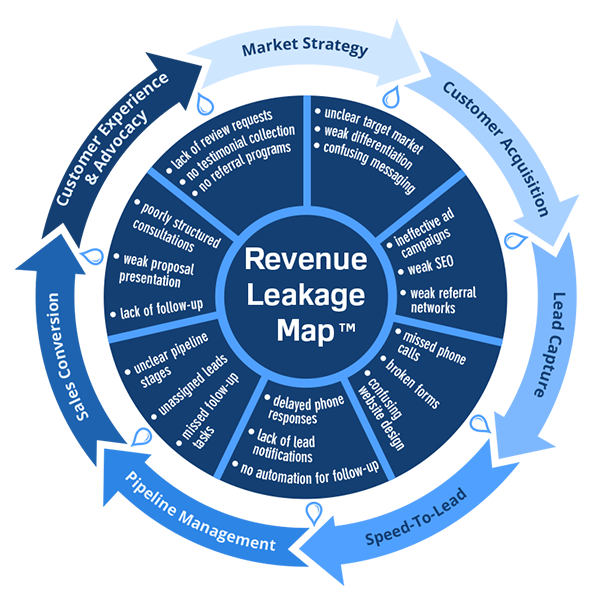
| Stage | Common Leaks |
| Market Strategy | Weak positioning, unclear targeting, poor‑fit audience |
| Customer Acquisition | Traffic volume without qualified opportunities, poor attribution |
| Lead Capture | Missed calls, broken forms, friction‑heavy booking flows |
| Speed‑to‑Lead | Delayed response, no lead alerts, weak after‑hours coverage |
| Pipeline Management | Unclear stages, stale deals, no next‑step discipline |
| Sales Conversion | Inconsistent discovery, weak proposals, no follow‑up |
| Customer Experience & Advocacy | Poor onboarding, no review requests, no referral system |
The Revenue Leakage Map™ functions as part of the broader Revenue Pipeline Diagnostic™ process.
It helps organizations:
The framework is designed to support structured analysis across the full revenue ecosystem rather than isolated tactical evaluation.
Diagnostic Deliverables:
Without visibility into where operational friction and revenue leakage exist, organizations often:
The goal of the Revenue Leakage Map™ is not simply to identify problems. The goal is to create greater clarity across the revenue ecosystem so leadership can make better decisions about what to fix, measure, and improve.
If operational inefficiencies, conversion friction, weak visibility, delayed response, or inconsistent performance are limiting growth, structured evaluation may help identify where the greatest opportunities for improvement exist.
Revenue Systems Consulting Group helps businesses improve the systems that drive revenue growth.